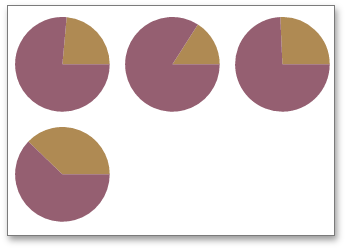
The Pie dashboard item allows you to specify the number of columns or rows in which pies are arranged. For example, the following image show pies arranged into 3 columns.
To control how cards are arranged, use the Layout section in the Pie's Options menu.
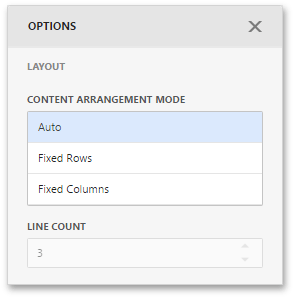
The following modes are available.
| Arrangement Mode | Description |
|---|---|
| Auto | Automatically resizes pies to fit within the dashboard item. |
| Fixed Rows | Allows you to arrange pies in a specific number of rows. |
| Fixed Columns | Allows you to specify the number of columns in which pies are arranged. |
To specify the number of rows / columns, use the Line Count field.
Pies display data labels that contain descriptions for pie segments, and provide tooltips with additional information.
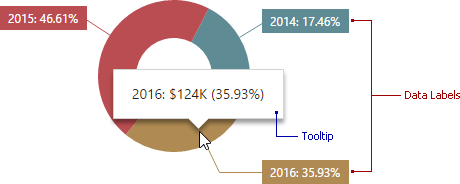
To configure data labels and tooltips, open the Pie's Options menu and go to the Labels section.
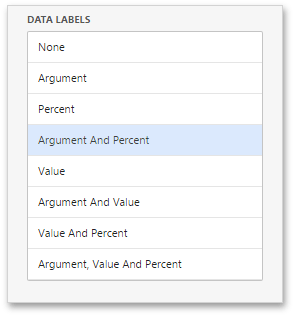
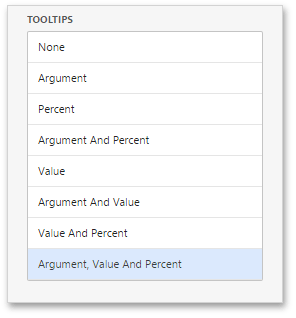
Here you can set argument, value, percent or their combinations as data labels or tooltips.
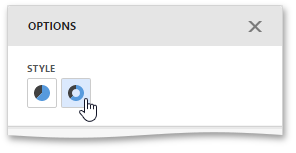
The Pie dashboard item allows you to select whether diagrams should be painted as pies or donuts.
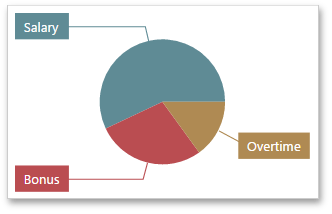
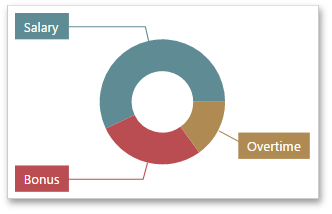
To select the diagram style, go to the Style section of the Pie's Options menu and use the Pie or Donut buttons.
