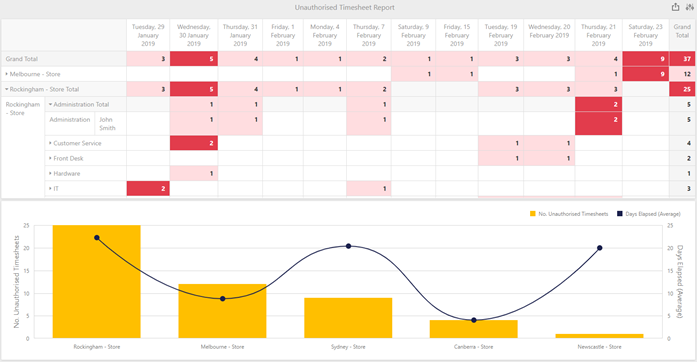
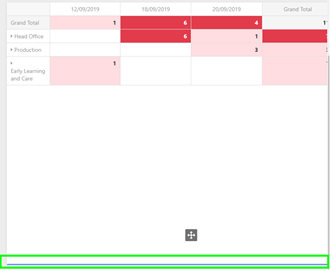
This guide will walk you through the steps to create your own copy of the Unauthorised Timesheet report similar to the one in the screenshot below.
Note: It is important to save often as you are creating this report. If the Data
Insights website times out, any unsaved work will be lost.
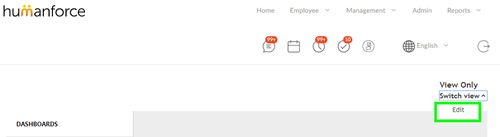
In the Data Insights screen select the Edit mode.
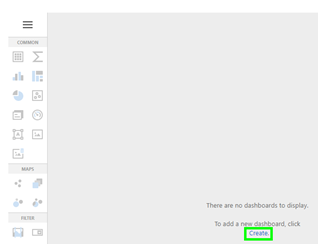
To create a new dashboard click on the Create link found in the middle of the screen.
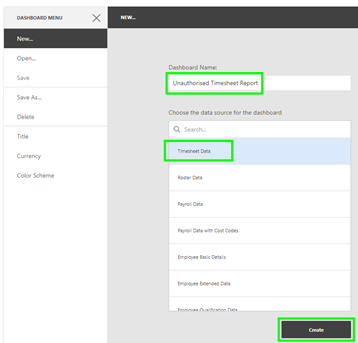
Give the Dashboard the name “Unauthorised Timesheet Report.” Make sure to select the Timesheet Data data source and click the Create button.
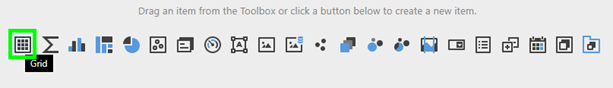
Next click the Grid button.
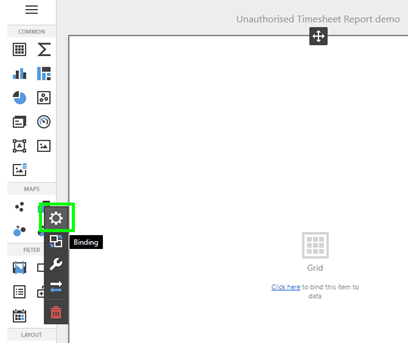
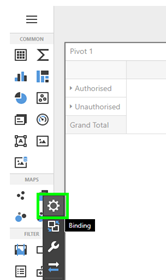
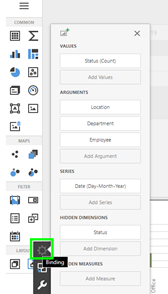
To add data to the screen click on the Binding button on the side menu that pops out.
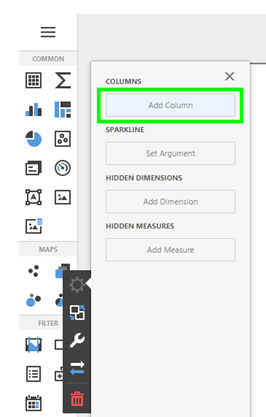
Click on Add Column to select the first data field called Status. Once selected a new button appears underneath called Add Column click to add additional data fields.
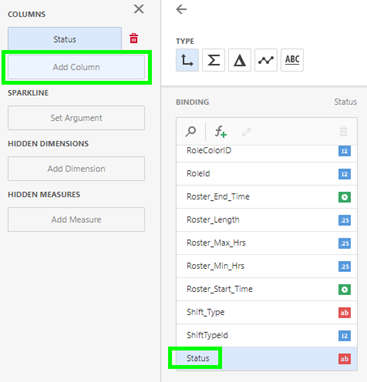
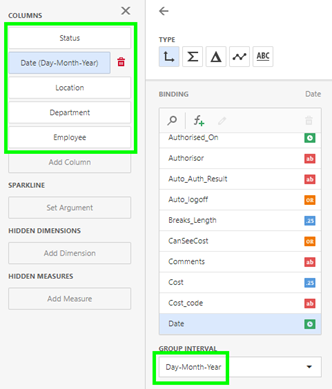
Add the following columns:
- Status
- Date (ensure the Group Interval is changed to DAY-MONTH-YEAR - see below)
- Location
- Department
- Employee
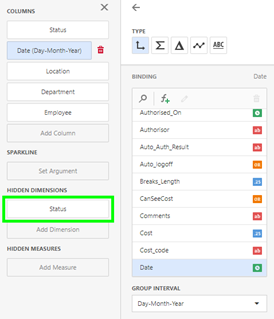
Under Hidden Dimensions click Add Dimension and select the Status field again.
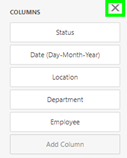
Next step is to review the data in the report. Click the X to close the Binding screen.
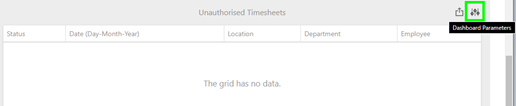
If there is no data shown on the screen, change the date range under the Dashboard Parameters button.
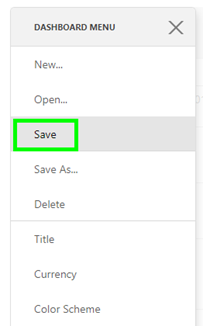
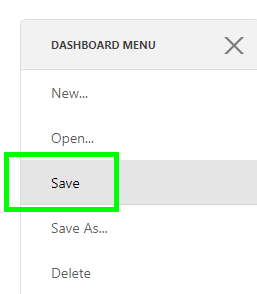
At this point save your work by clicking the 3 lines on the top left of the report screen and selecting the Save button.
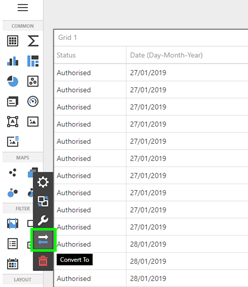
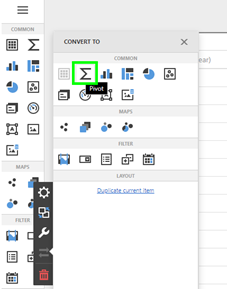
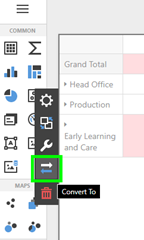
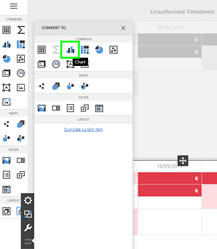
Once you have confirmed there is data on the screen, we can convert the report from a Grid to a Pivot chart. To do this, click anywhere on the report to popup the side menu and choose the Convert To button. A new popup will appear, choose the Pivot button.
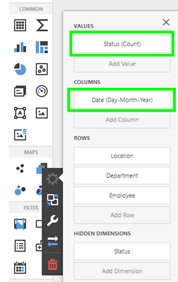
Click anywhere on the report screen to popup the side menu and choose the Binding button. Drag and drop the Status field from ROWS section to the VALUES section and drag and drop Date field to the COLUMNS section.
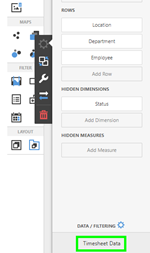
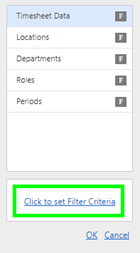
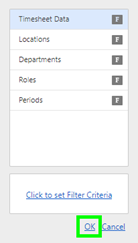
Currently the report is showing both Authorised and Unauthorised timesheets. The next step will apply a filter to show only Unauthorised timesheets. At the bottom of the Binding popup menu select the Data / Filtering button. A new popup will appear, click on Click to Set Filter Criteria link.
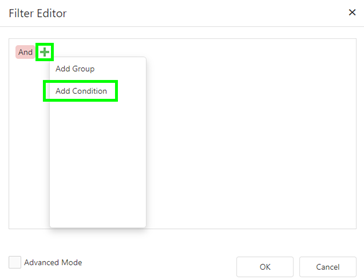
Hover your mouse to the right of the And button and click on the + sign when it appears. Choose Add Condition.
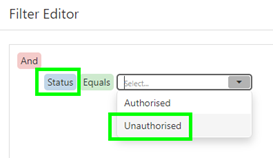
Ensure the blue button says Status, the green button says Equals and choose from the drop down options Unauthorised. If Unauthorised doesn’t appear this means there is no Unauthorised timesheets in the date range you have selected. Either type "Unauthorised" (this is case sensitive) or go back and choose a different range. Once completed click the OK button.
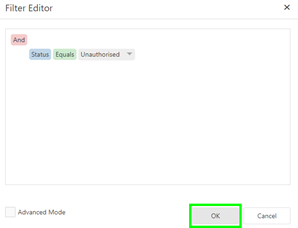
Click the OK button at the bottom of the Binding menu screen.
The results on the screen should now be limited to Unauthorised Timesheets only.
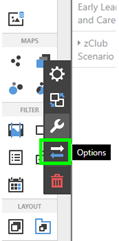
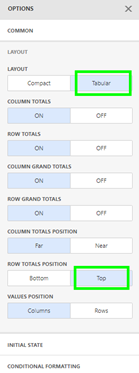
Click anywhere on the report to popup the side menu and choose the Options button. Under the Layout section choose Tabular and under the Row Totals Position choose Top.
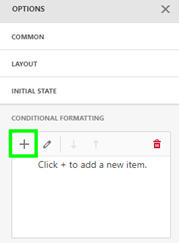
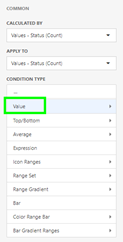
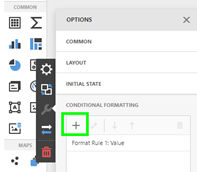
Next step is to bold every number on the report screen so it is easier to see. Under the Conditional Formatting section click the + button and then select the Value option.

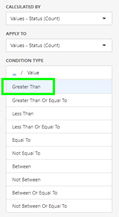
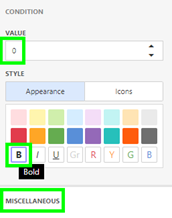
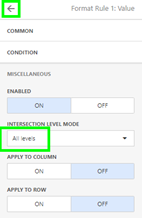
Select the Greater Than option, leave the value at 0 and select the Bold button. Then select the Miscellaneous section. Change the Intersection Level Mode to All Levels and then click on the Back Arrow button.
This next step will add conditional formatting to the report, this is done with by separating the report into different sections. The conditional formatting will show a group of numbers that are in the top 50% in dark red and anything in the bottom 50% of that group of numbers in light red.
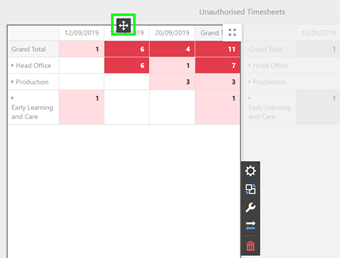
We will show the numbers grouped by the Dates columns separately from the Grand Total column (shown below by the blue box for the Dates column and orange box for the Grand Total column).
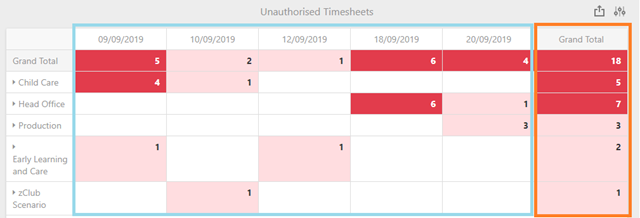
The rows are grouped separately, too: Locations from Departments from Employees from the Grand Total. The screenshot below shows how the grouping works, for example the green sections are the location groupings.
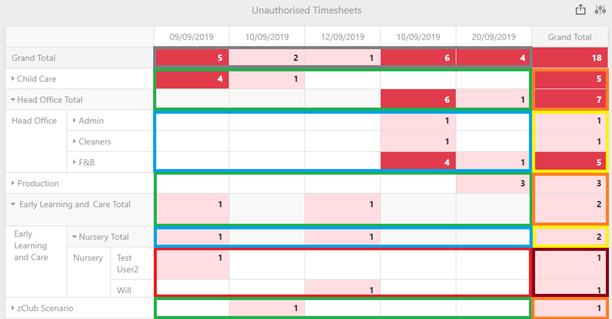
The coloured boxes in the above image will be referred to in the next section.
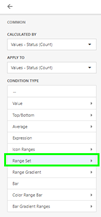
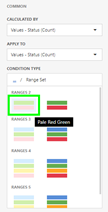
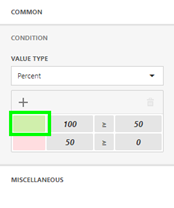
To start, we will add conditional formatting to the Grand Total row for the Dates column, shown as the dark grey box in the image above. Click on the + button and choose the Range Set option. Select the Pale Red & Green option.
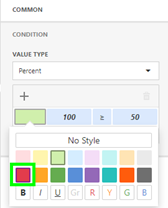
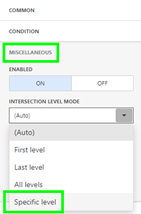
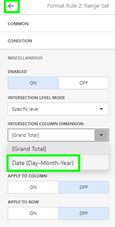
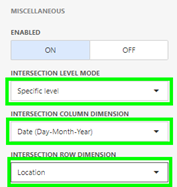
Select the Pale Green colour button and change it to the Red colour. Next select Miscellaneous section and the Intersection Level Mode to Specific Level. Change the Intersection Column Dimension to Date (Day-Month-Year) and then click on Back Arrow button.
Repeat this step for all the different sections on the report as follows.
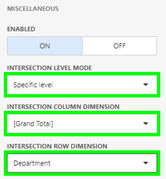
For Location row on the Dates column (Dark green box) use this setting:
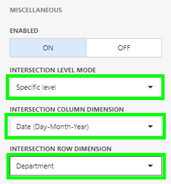
For Department row on the Dates column (Blue box) use this setting:
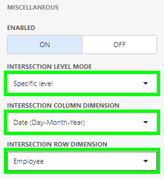
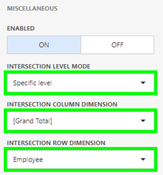
For Employee row on the Dates column (Red box) use this setting:
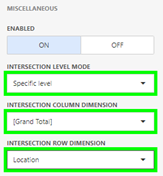
For Location on the Grand Total column (Orange box) use this setting:
For Department row on the Grand Total column (Yellow box) use this setting:
For Employee row on the Grand Total column (Maroon box) use this setting:
This completes the top half of the report. Make sure to save your report at this point!
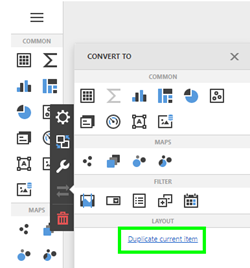
This next part will show you how to create the bottom half of the report. Click anywhere on the report to popup the side menu and select the Convert To button. Click on the Duplicate current item link which makes a copy of your report.

Click anywhere on either of the two reports and a four-way arrow will appear. Using the four-way arrow, drag the report under the other report. Drop (release the mouse button) when you see the blue line appear.
Click anywhere on the bottom report and the popup side menu will appear and select the Convert To button. Choose the Chart button.
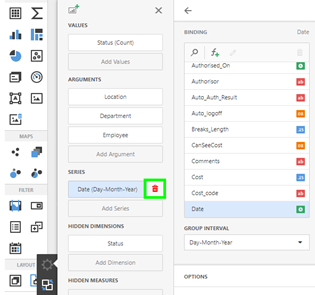
Click anywhere on the bottom report and select the Binding button on the popup side menu. Click on the Date (Day-Month-Year) option. When the Red Bin appears, click on it to delete.
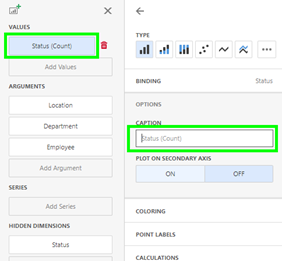
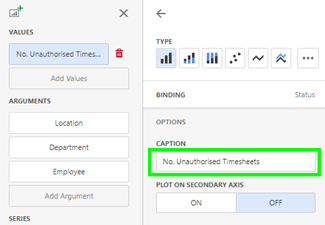
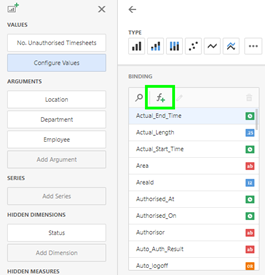
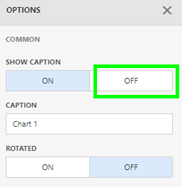
Select the Status (Count) and under the Options section change the Caption to “No. Unauthorised Timesheets”.
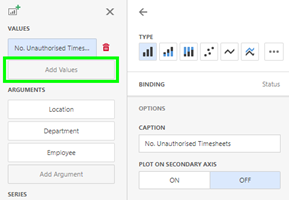
Click on the Add Values button, then click the f+ button.
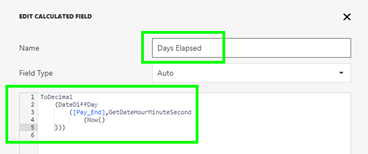
A new popup will appear. Change the Name to “Days Elapsed” and add the following formula in the box below the Field Type:
ToDecimal
(DateDiffDay
([Pay_End],GetDateHourMinuteSecond
(Now()
)))
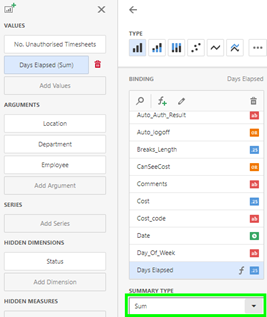
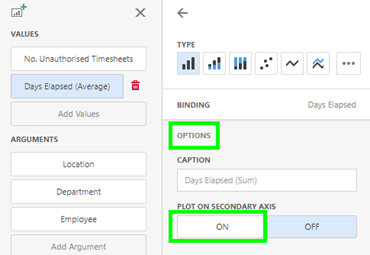
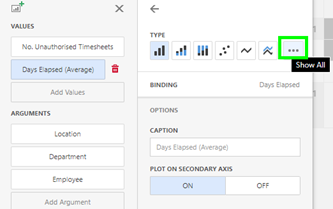
Press the Save button and change the Summary Type from Sum to Average. Select the Options section and under the Plot On Secondary Axis press the On button.
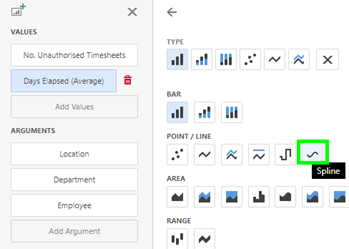
Click on the Show All button and choose the Spline button.
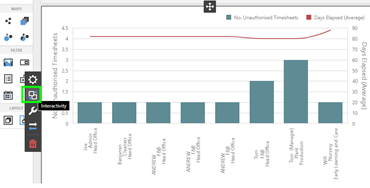
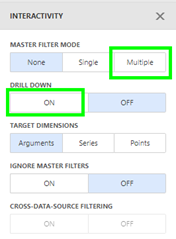
Click on the Interactivity button and under the Master Filter Mode section, select the Multiple option. Under the Drill Down section, select the On option.
Select the Options button and choose the Off option under the Show Caption section.
Make sure to Save your report and you are finished!
For more on Workforce Analytics refer to Workforce AnalyticsOverview