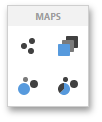
Data Insights allows you to create three types of Geo Point maps.
-
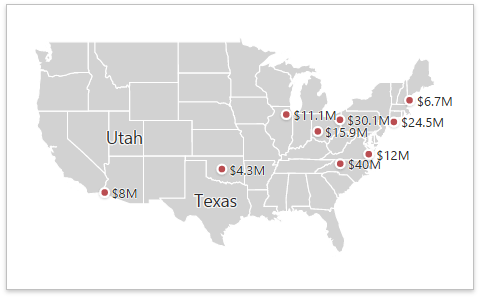
The Geo Point Map dashboard item allows you to place callouts on the map using geographical coordinates.
-
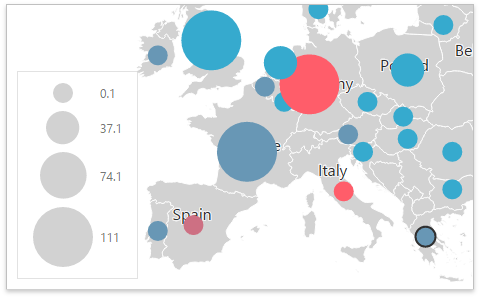
The Bubble Map dashboard item allows you to place bubbles on the map. Each bubble can represent data using its weight and colour.
-
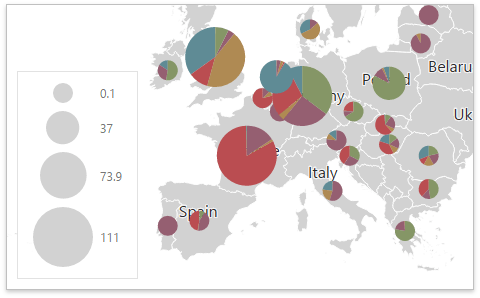
The Pie Map dashboard item allows you to display pies on the map. Each pie visualises the contribution of each value to the total.
To create the required Geo Point Map dashboard item, use the Maps section in the Toolbox.
The Bubble Map provides two types of legends used to identify map objects - colour and weighted legends.
Colour Legend
The colour legend helps you identify which colours correspond to specific values.

To specify colour legend settings, go to the Colour Legend section of the Bubble Map's Options menu.
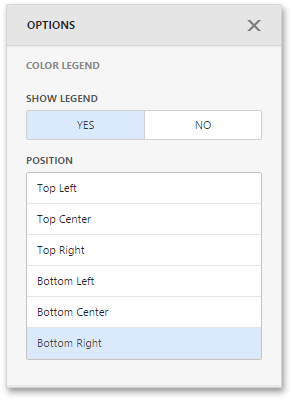
Here you can show or hide the colour legend and change its position.
Weighted Legend
The weighted legend allows you to identify values corresponding to specific bubble sizes.
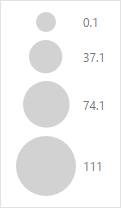
To specify weighted legend's settings, go to the Weighted Legend section of the Bubble Map's Options menu.
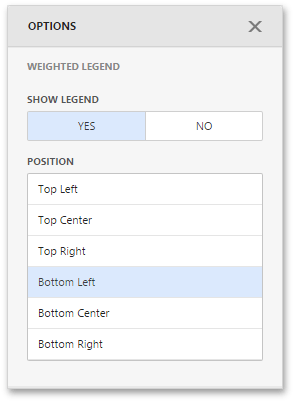
Here you can show or hide the weighted legend and change its position.
When a Geo Point map contains a large number of objects (callouts, bubbles or pies), showing each object individually on the map is not useful. The Web Dashboard provides the capability to group neighbouring map objects. This feature is called Clustering.
For instance, the Geo Point Map dashboard item combines callouts to bubbles.
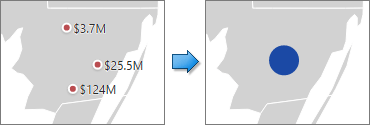
The Bubble Map and Pie Map dashboard items cluster bubbles/pies with other bubbles/pies.
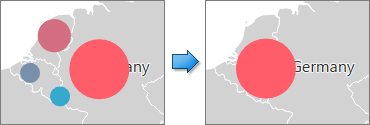
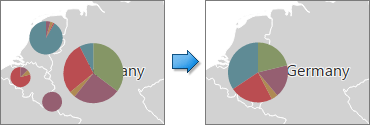
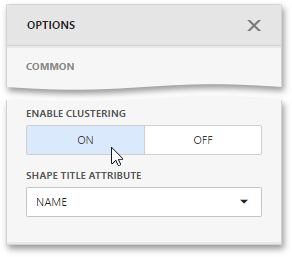
To enable clustering in the Web Dashboard, use the Enable Clustering option in the Geo Point Map's Options menu.
The Geo Point Map dashboard item allows you to perform navigation actions such as zooming and scrolling using the mouse.
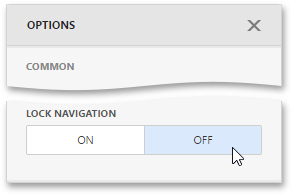
You can enable or disable the capability to scroll/zoom the map using the Lock Navigation option in the Geo Point Map's Options menu.
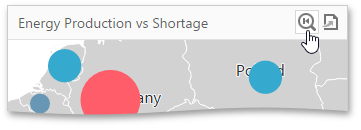
To display the entire map within the dashboard item, use the Initial Extent button (the  icon) in the Geo Point Map's caption.
Geo Point maps provide the capability to display titles within map shapes and allow you to add supplementary content to the callout/bubble/pie tooltips.
Shape Titles
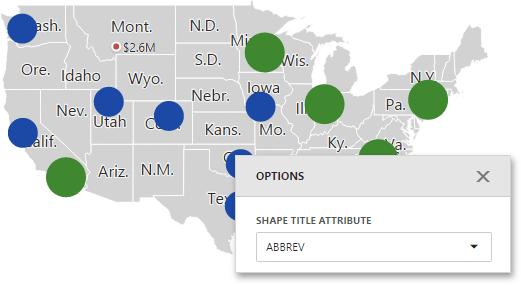
To manage map titles, use the Shape Title Attribute option of the Map's Options menu.
Here you can select the attribute whose values are displayed within corresponding map shapes.
Tooltips
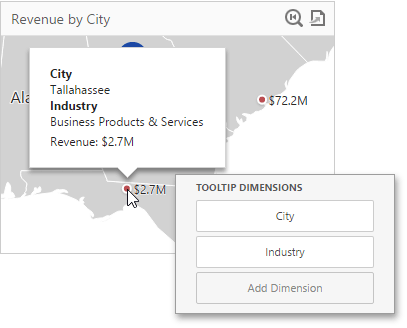
Geo Point maps also allow you to add supplementary content to the callout/bubble/pie tooltips using the Tooltip Measures and Tooltip Dimensions data sections.
To add an additional information, click a placeholder contained in one of the available data sections and select the required measure/dimension in the Binding section of the invoked data item menu.
